Activity diagrams is, just like use case diagrams and class diagrams, part of the Unified Modeling Language (or UML). Activity diagrams help visualising workflows, processes or activities within a system. They show how parts of a system move and how one thing connects to another.
Oh yeah, why don't you cite a source?
The source of the activity diagram information i used can be found here
What are activity diagrams
Activity diagrams are a way to show the steps of how a system works. They will be displayed in what order they play out and whether things occur at the same time, or one after the other (concurrent or sequential). They start and end at a single point.
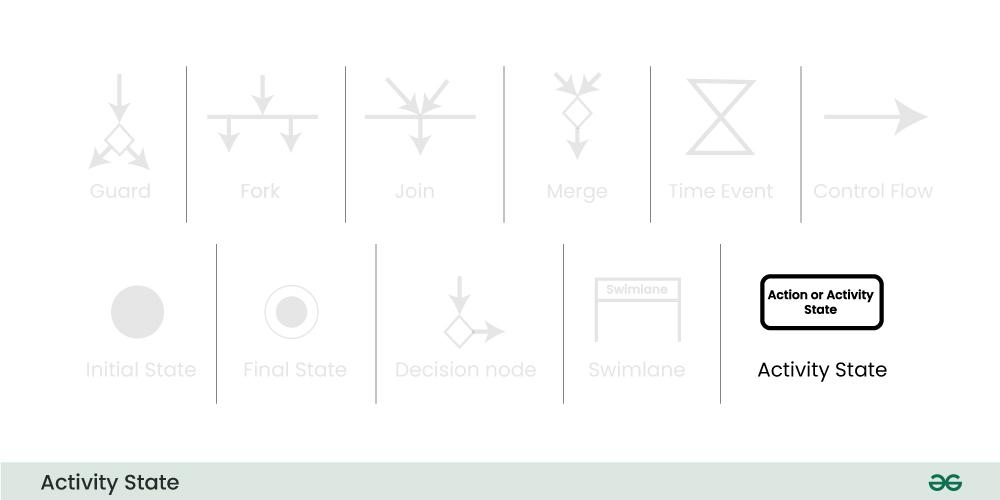
Activity diagram notations
1. Initial State
 source: geeksforgeeks.org
The initial state is where the process starts. It marks the entry point
Only one initial state exists unless there are nested activities.
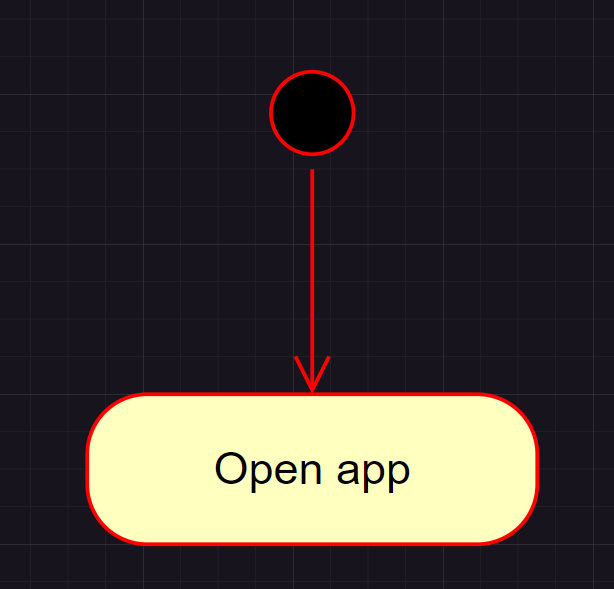
Example
Not much going on at the moment
2. Action or Activity state
 source: geeksforgeeks.org
An activity represents the execution of an action either on or by objects. It it shown by a rounded rectangle. Basically every action or event that takes place is represented by an activity.
Example
3. Action flow or control flows
 source: geeksforgeeks.org
Action or control flows are also referred to as paths and edges. They are used to show the transition from one point to the other using a line with an arrow head. If there is some rule or constraint to be adhered to, it will be mentioned on the arrow.
Example
4. Decision node and branching
 source: geeksforgeeks.org
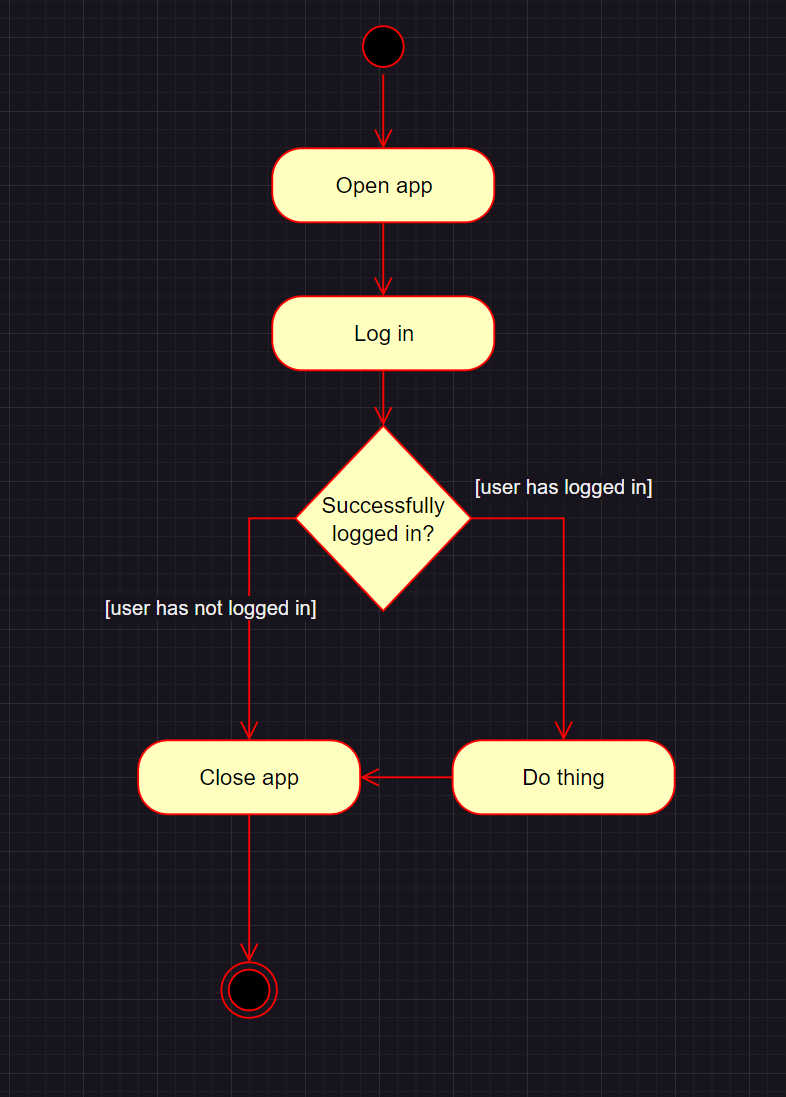
Decision nodes are used for, you guessed it, decisions. Whenever some choice has to be made, the decision node will be used. The outgoing arrows from the decision node can be labelled with conditions or guard expressions. These nodes always have two or more output arrows.
Example
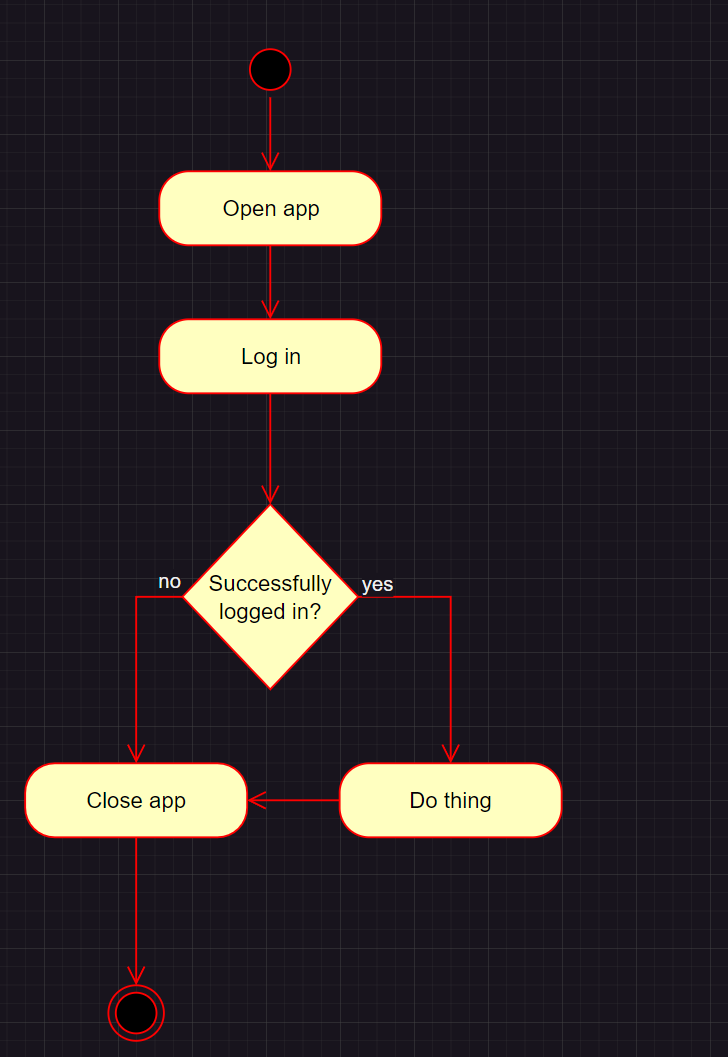
5. Guards
 source: geeksforgeeks.org
A guard refers to a statement that is sometimes written next to a decision node on an arrow within a square bracket. This decides whether the flow will go one or the other way.
Example
6. Fork
 source: geeksforgeeks.org
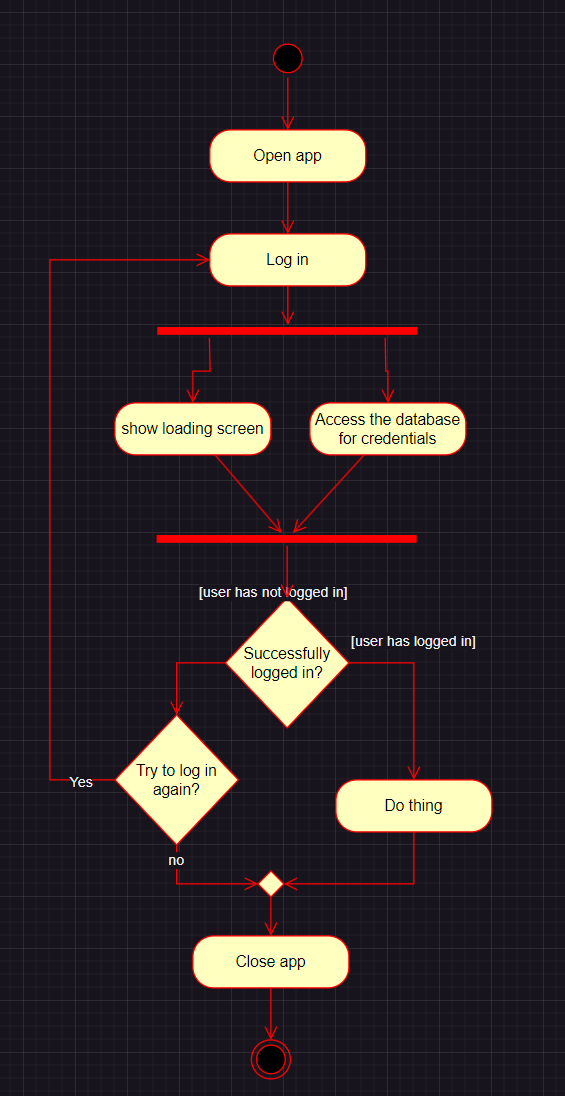
Forks represent a split in the flow that runs both paths at the same time (concurrent). No decision will be made before the split. A fork is represented by a black bar with one arrow going in and two or more arrows going out.
source: geeksforgeeks.org
Forks represent a split in the flow that runs both paths at the same time (concurrent). No decision will be made before the split. A fork is represented by a black bar with one arrow going in and two or more arrows going out.
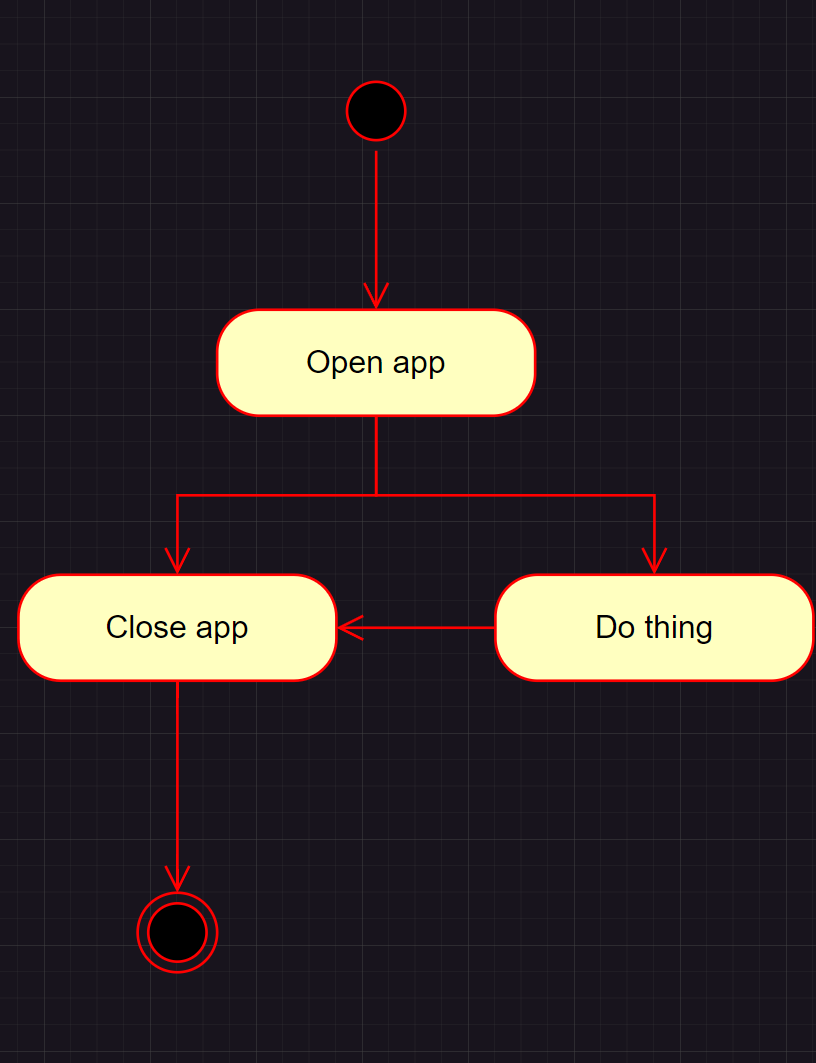
Example
I am so good at making examples
7. Join
 source: geeksforgeeks.org
A join is basically a fork, but instead of arrows going out, the flow joins back into one line again. They look the same as forks, but inversed.
8. Merge or Merge events
 source: geeksforgeeks.org
A merge is a join statement for flows that do no run concurrently. If you for example have a decision node that splits into two paths, converging those paths together would use a merge node and not a join.
Example
9. Swimlanes
 source: geeksforgeeks.org
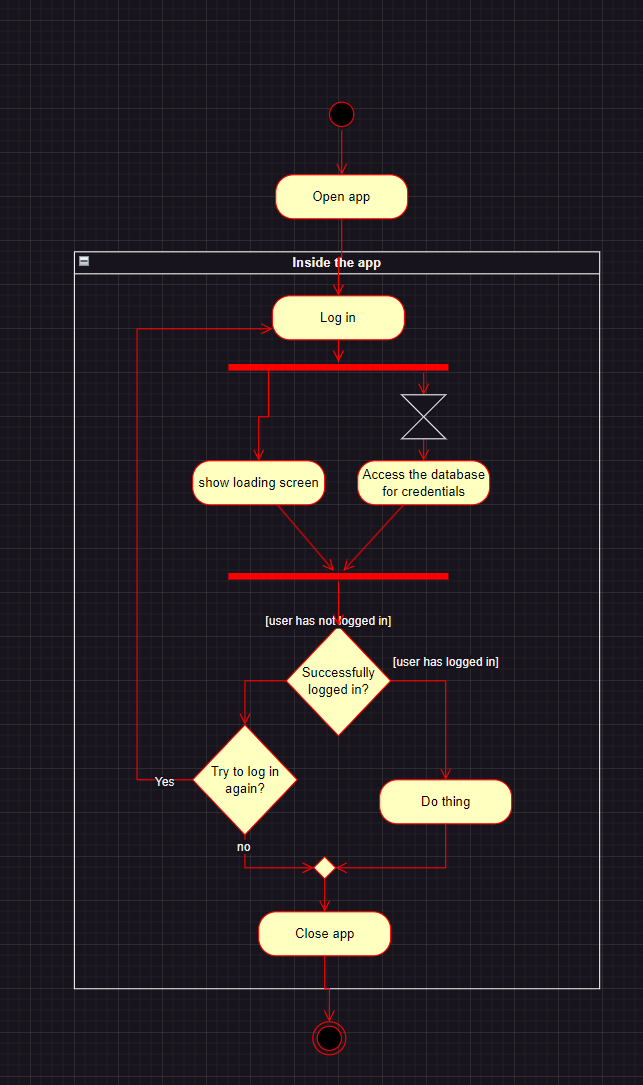
Swimlanes are used to group together related activity into one column or row. They can be horizontal and vertical. Swimlanes are optional, but they are used to add modularity to the diagram, though they are a recommended good practice. It is more used as a visual aid instead of adding functionality. Swimlanes are represented by a bar with two lines sticking out.
Example
Bad example, but you get the gist of it.
10. Time event
 source: geeksforgeeks.org
A time event is represented by an hourglass and means a flow will be stopped for some time. If you for example have a database request that takes some time to complete, you can add a time event.
Example
11. Final state or End state
The final state in the system is when every activity ends. It is represented by a red circle with a filled circle inside. A system or process can have multiple final states.
Example
Notice how the initial state and final state look diffrent.